
Real-time OEE Analytics & Industrial Efficiency Tracking
Measure Overall Equipment Effectiveness (OEE) dynamically across lines and shifts. Track Availability, Performance, and Quality to eliminate the Six Big Losses.
Manufacturing OEE Intelligence
Deconstruct equipment run histories live to prioritize setup and quality loss solutions.
Availability Calculator
Log downtime events to compute planned vs actual running time.
Improvement: Tracks machinery uptime.
Performance Monitoring
Compare speed cycles against ideal standards to spot micro-stops.
Improvement: Recovers capacity limits.
Quality Yield Tracking
Calculate scrap rate ratios by batch or shift.
Improvement: Minimizes material waste.
Six Big Losses Charting
Group loss logs into TPM categories for structured prioritization.
Improvement: Directs improvement efforts.
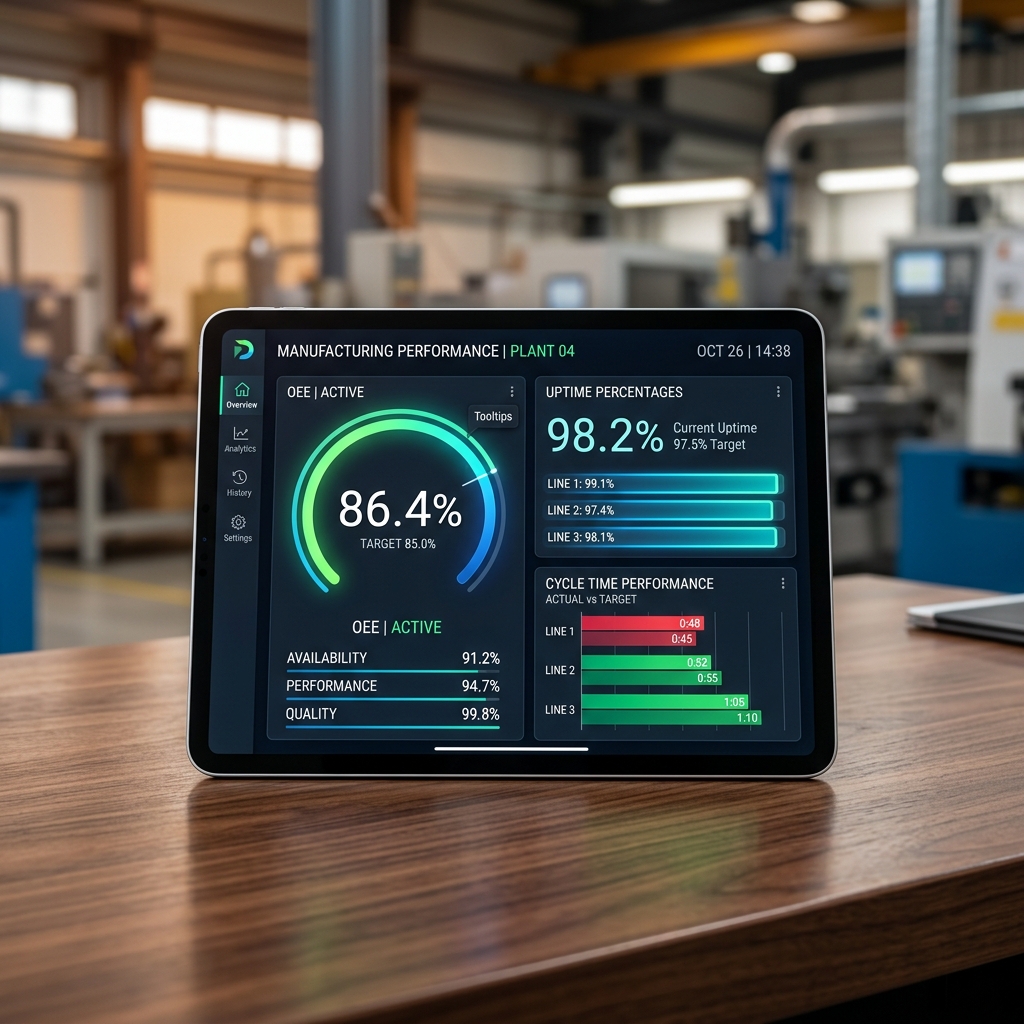
What is OEE?
Overall Equipment Effectiveness (OEE) measures manufacturing productivity. It calculates the percentage of planned production time that is truly productive: 100% OEE means you are producing only good parts, as fast as possible, with no stop time.
Availability
Performance
Quality
OEE %
Real-Time OEE Monitoring
Get instant visibility into equipment effectiveness with real-time OEE dashboards. Monitor every machine, production line, and shift—see exactly where productivity is being lost and take action before it impacts output.
Live OEE Scores
Real-time Availability, Performance, and Quality scores.
Production Targets
Track actual vs target output in real-time.
Shift Comparisons
Compare OEE across shifts, runs, and operators.
Instant Alerts
Receive alerts when metrics drop below custom thresholds.
Live Production Monitor
LiveCNC Machine #1
OEE ScorePress Line #2
OEE ScoreAssembly #3
OEE ScoreSix Big Losses Breakdown
Track the Six Big Losses
Identify and categorize the root causes of manufacturing yield and speed losses with the TPM Six Big Losses framework. Target areas like setup downtime, micro-stops, and scrap rates to recover capacity.
Equipment Failures
Unplanned breakdowns and tooling failures.
Setup & Adjustments
Downtime during tooling changeover.
Idling & Minor Stops
Short stops that slip through normal logging.
Reduced Speed
Equipment running slower than rated capacity.
Inspections Connected to Every Module
Pure Technology's platform integrates seamlessly with all maintenance modules for complete operational visibility.
Work Orders
Auto-generate from failures
Assets
Link to equipment history
Preventive Maintenance
Schedule from findings
Reports & Analytics
Inspection metrics dashboards
Team
Inspector assignment flows
EHS Management
Safety & compliance audits
Incidents
Report & track site failures
Documents
Attach manuals & templates
Numbers from real engagements.
Drive immediate output gains by identifying and recovering hidden capacity bottlenecks.
Highlight and address short, recurring speed losses that slip under the radar.
Pivot data by shift, product, batch, or machine to pinpoint performance issues.
Built for teams that need this to just work.
Who this is for
- Plant and Operations Managers who need to optimize line utilization and shift output.
- Production Supervisors tracking live line performance and shift changes.
- Industrial and Process Engineers analyzing bottleneck root causes and changeover times.
- Continuous Improvement and TPM Leaders driving structured loss recovery programs.
The operational building blocks your team needs.
Standardize OEE measurement across assets and sites while fitting the specific telemetry and workflows of each line.
The Six Big Losses Monitor
Deconstruct downtime into setup delays, minor stops, speed loss, startups, and production defects.
Availability, Performance, Quality (APQ)
Calculate key OEE pillars live and compare plant-wide indicators to world-class 85% benchmarks.
Dynamic Shift & Line Dashboards
Give supervisors and plant managers visual trends to spot performance decay before the shift ends.
CMMS Integrated Root-Cause
Connect downtime events directly to maintenance logs to analyze repeat equipment failure roots.
From the shop floor to the leadership view.
Designed for rapid operator adoption, automatic data capture, and transparent plant performance tracking.
Operator Live Screen
Let operators tag downtime events and log changeovers with one tap at the line side.
Supervisors Shift Review
Review shift performance, confirm loss allocations, and log handovers before leaving.
Plant-Wide Dashboard
Monitor real-time OEE, production targets, and line status at a glance from any screen.
SCADA & PLC Integration
Ingest runtime signals automatically to capture micro-stops without operator input.
CMMS Integration
Route repeat failure root causes directly to maintenance queues as actionable work orders.
Enterprise OEE Analytics
Compare performance, loss trends, and OEE benchmarks across multiple lines and plants.
A repeatable path, every time.
1. Discover Telemetry
Audit existing telemetry, SCADA/PLC systems, manual logs, and define baseline OEE metrics.
2. Configure Pipelines
Integrate automatic machine signals, build line dashboards, and map reason codes to the Six Big Losses.
3. Launch Focused Pilot
Deploy on one production line or work cell to establish operator buy-in and validate data accuracy.
4. Scale Across Plants
Roll out to remaining production lines and integrate OEE analytics into daily shift reviews and CI workflows.
Industrial technology your operation can rely on.
We combine industrial data, connected workflows, and secure integrations to make this solution practical for real plant operations.
Industrial Data Layer
Plant data foundation
Workflow Engine
Digital operations
Operational Analytics
Decision support
Plant Dashboards
Performance visibility
The questions we hear most.
How is OEE calculated?+
OEE is calculated by multiplying Availability (run time vs. planned production time), Performance (actual speed vs. ideal cycle time), and Quality (good parts vs. total parts produced).
Can this integrate with our PLCs/SCADA for automatic data capture?+
Yes. We support standard industrial protocols like OPC UA, MQTT, and direct database queries to capture machine state signals automatically, reducing manual logging.
How do shift comparisons work?+
The system logs OEE metrics continuously and groups them by shift schedules. Supervisors can compare OEE, downtime events, and loss categories across shifts, crews, and products.
What counts as a Six Big Losses event?+
It includes equipment failures, setup and adjustments (Availability losses), idling and minor stops, reduced speed (Performance losses), and startup defects and production rejects (Quality losses).
Most engagements span more than one practice.
Free consultation
Turn Your Vision
Into Reality


Ready to scope this in detail?
A 30-minute call with a senior engineer. No sales theatre — just a real assessment of fit, scope, and timeline.