
Live dashboards for the decisions happening now.
Give shop-floor teams and leaders a shared view of production, quality, maintenance, and improvement indicators as they change.
Visual Plant Management
Unify machine outputs, quality exceptions, and open work orders in a single visual grid.
Shop Floor Dials
Display OEE and line speeds on Andon boards for immediate team visibility.
Improvement: Improves shift ownership.
Real-time Escalations
Alert shift leaders immediately when throughput targets drop below line limits.
Improvement: Shortens response lag.
Role-based Dashboards
Tailor screens for operators, engineers, supervisors, and plant managers.
Improvement: Clarifies target tasks.
Unified Data Streams
Sync machine outputs, quality logs, and open work orders in one grid.
Improvement: Unifies team picture.
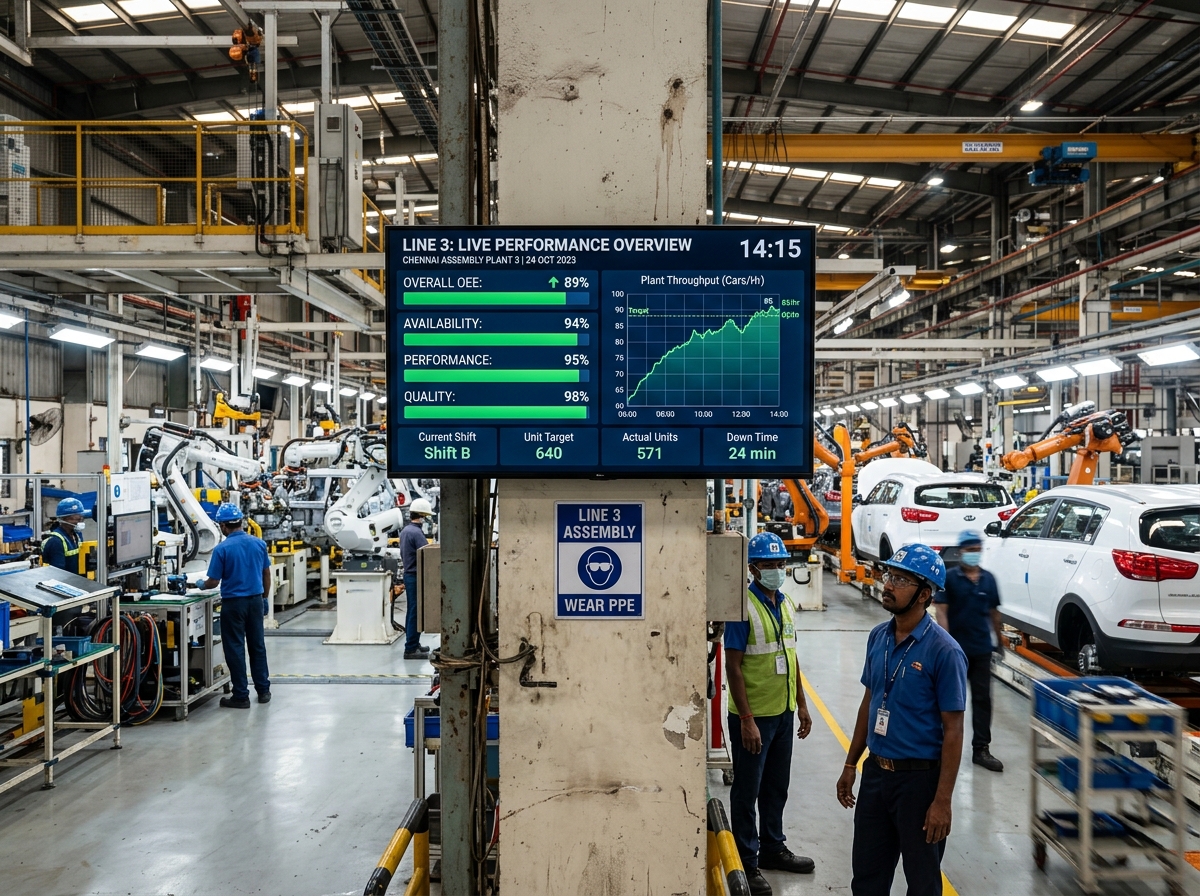
Interactive Shopfloor Boards
Give operations and maintenance teams a shared, real-time view of OEE, yield, and active alerts.
Role-Based Layouts
Configure custom views for operators, supervisors, and managers.
Live Widgets
Display trend charts, OEE gauges, and alert counters.
Breach Alarms
Flash dashboard screens and trigger alarms when parameters breach limits.
Multiple Feeds
Combine historian signals, quality records, and inventory data.
Shift Handovers
Sign off shift reports and note handovers directly on screens.
KPI Calculations
Calculate OEE, yield, MTTR, and compliance scores continuously.
BOARD-2026: Line 4 Production Summary
6-Step Live Dashboard Deployment
Connect sources, map parameters, build views, set alert rules, mount screens, and monitor operations.
Data Sources
Establish connections to PLC tags, CMMS databases, and quality logs.
Acknowledge Dashboard Alarm
Step-by-step guidance for operators to resolve and clear process alarms on active screens.
Touchscreen Optimization
Large buttons and layouts designed for gloved shopfloor operations.
LOTO Alerts
Display LOTO status prominently on screens.
Action Logging
Record operator actions and alarm clearance timelines.
Offline Sync
Buffer alarm events locally; sync when network is restored.
Resolve Active Alarm
Identify Alarm Source
Extruder Temperature Warning (164°C)
Input Correction
Acknowledge alarm and increase coolant flow rate by 5%
Verify Safe State
Verify temperature returned to 158°C baseline
Verification Schedule
Due TodayOEE Calculation Audit
Verify downtime categories against historian • Shift Team
Metric Mapping Review
Review variable mappings after system update • Engineer-Led
Dashboard Audits
Schedule reviews to check indicator configurations and confirm dashboard metrics remain accurate.
Accuracy Audits
Schedule quarterly audits of dashboard configurations.
Concept Drift Alerts
Flag metrics that drift from baseline calculations.
Verification Logs
Log verification details next to dashboard configuration files.
Interactive Planners
View all scheduled audits in a unified calendar view.
Operational Alerts
Log critical parameter limit breaches, alerting supervisors to operational issues.
Immediate SMS Alerts
Send automated text alerts to shift supervisors.
Roadblock Registers
Record operator comments and roadblock flags.
Telemetry Snapshots
Capture 60 minutes of parameter histories surrounding alerts.
Audit Trail Compliant
Log comments and clearance signatures in a secure registry.
Active Alert Ticket
ALM-2026-08Process Parameter Breach
Aug 13, 2026 • 11:47 AM82.4% OEE
Current Level (Target 85%)15 min
Alert DurationDetails
Line 4 OEE index dropped below target (85%) for 15 consecutive minutes. Feeder queue delays flagged as primary bottleneck.
Performance RCA File
RCA-ALM-085 Whys Trace
OEE Loss Investigation
Investigate dashboard-flagged OEE losses, identify root causes, and log corrective actions.
Downtime Trace
Link OEE losses to specific downtime events automatically.
5 Whys Logging
Log structural explanations next to dashboard timeline charts.
CAPA Workflows
Generate spacer adjustment tasks directly from root causes.
Insight Archive
Search past RCA records to resolve similar process anomalies.
Supported Dashboard Widgets
Select from multiple visualization formats to display key performance indicators.
OEE Gauge Panels
Display real-time availability, performance, and quality pillar scores.
Downtime Pareto Charts
Show active and historical downtime causes by duration.
Process Control Trend Lines
Monitor parameters and check limits in real-time.
Alert Boards
Keep active process alerts visible in a unified registry.
Connected Operational Boards
Integrate live dashboards with plant historians, registries, and logs.
Historian Data Links
Maintain real-time connections to OSIsoft PI and Honeywell databases.
CMMS Platforms
Sync active maintenance schedules and technician locations.
Quality Systems
Display control chart points and calibration states.
Shift Logs
Capture shift handovers next to dashboard timelines.
Numbers from real engagements.
Align teams around current performance instead of separate reports.
Surface exceptions while a supervisor can still intervene.
Keep the measures that matter visible in meetings and on the floor.
Built for teams that need this to just work.
Who this is for
- Plant and operations leaders who need timely, reliable decisions from production data.
- Quality, maintenance, and process teams moving beyond disconnected paper and spreadsheets.
- Manufacturers standardising workflows across lines, shifts, and sites.
- Digital transformation teams that need a pilot with a clear operational metric.
The operational building blocks your team needs.
Each implementation is configured around your process, decision points, and evidence requirements — not a generic software rollout.
Role-based views
Present the right operational measures for operators, supervisors, and plant leadership.
Connected data
Bring together machine, quality, maintenance, and manual workflow signals in one view.
Actionable alerts
Highlight exceptions and thresholds that call for a response, not just reporting.
From the shop floor to the leadership view.
The solution is designed to fit the people, systems, and controls already operating in your plant.
Role-based workflows
Give operators, supervisors, engineers, and leaders the right tasks, approvals, and level of detail.
Action and escalation
Turn exceptions into owned follow-ups with clear status, context, and accountability.
Connected data
Bring together equipment, forms, files, and business-system data where it improves the operational decision.
Audit-ready evidence
Retain structured records of checks, changes, actions, and results for internal and customer reviews.
Multi-site standards
Use common workflows and measures while retaining the flexibility each plant needs.
Measured rollout
Start with a focused pilot and scale only after adoption and business impact are demonstrated.
A repeatable path, every time.
Discover
Map the current workflow, data sources, decision owners, and the metric that matters.
Configure
Set up forms, rules, integrations, and role-based views around the way your plant works.
Pilot
Run the solution on a focused line or workflow, validate adoption, and measure the result.
Scale
Extend proven workflows across assets and sites with governance and continuous improvement.
Industrial technology your operation can rely on.
We combine industrial data, connected workflows, and secure integrations to make this solution practical for real plant operations.
Industrial Data Layer
Plant data foundation
Workflow Engine
Digital operations
Operational Analytics
Decision support
Plant Dashboards
Performance visibility
The questions we hear most.
Can this work with our existing systems?+
Yes. We assess your current equipment, spreadsheets, ERP, MES, and data sources first, then integrate where it creates practical value.
Do we need to replace machines or software?+
No. The implementation is designed to complement your existing operation and can start with the data and tools you already use.
How do we start?+
We begin with one defined workflow, site, or production line and agree on the operational measure that will determine pilot success.
Most engagements span more than one practice.
Free consultation
Turn Your Vision
Into Reality


Ready to scope this in detail?
A 30-minute call with a senior engineer. No sales theatre — just a real assessment of fit, scope, and timeline.